Introduction
NeuroMMSig
Multimodal Mechanistic Signatures Database for Neurodegenerative Diseases (NeuroMMSig) is designed to allow users to retrieve candidate mechanisms, represented as chains of cause and effect graphs, that fits best to any pattern of experimental data (e.g., gene or SNP set, or a list of imaging features). NeuroMMSig has also been enriched with drug information offering feasible drugs that could be a target for the proposed mechanisms. NeuroMMSig integration of different data scales allows to find the most meaningful mechanisms which suit or better explain the experimental data. This can lead to patient stratification based on data and personilized medicine based on mechanism identification.Introduction
NeuroMMSig offers a web interface where users can submit data to infer mechanistic signatures in the context of neurodegenerative diseases. NeuroMMSig allows submission of multiscale data from molecular to clinical level to return mechanisms that fit best the data. NeuroMMSig is inspired from Molecular Signatures Database (MSigDB), Broad Institute and the models underlying the server are coded in the Biological Expression Language (BEL).How NeuroMMSig is different from MSigDB
- Molecular Profile data is NDD specific: We have curated NDD specific GE data, imaging data etc. On contrast, MSigDB genesets are limited to lists of ranked associated pathways (e.g., GSEA) without including disease-related information.
- Multimodal: Multiple types of data is integrated with knowledge based mechanistic model like genes, chemicals, ions, drugs, imaging and clinical data, SNPs, epigenetics etc. Alternatively, MSigDB pathways contains only genes, modified proteins, bioprocesses.
- Mechanisms are NDD specific: not all available canonical pathways (KEGG, REACTOME etc) are disease specific. Rather it is representing a general static pathway, not a mechanism of a disease. According to KEGG, there are only 10 pathways under NervousSystem Not all genes and relationships described in one canonical pathway may or may not be involving as same as in a disease specific mechanism or some genes are irrelevant to disease context. As an example, figure 1 represents how amyloid beta disrupts the neutrophin signaling pathway in AD via UCHL-1 inhibition and comepting for the binding of NGF with NGFR, which eventually leads to neuron death. On the top of the cartoon, the neutrophin signaling pathway cartoon from Kyoto Encylopedia of Genes and Genomes (KEGG), where smoe important actors in the example do not appear (Minoru. K, and Goto. S., 2000).
- Tools: Pathway analysis methods do not offer the user the possibility to explore and run algorithms on the networks. However, NeuroMMSig allows to combine and apply different algorithms into the networks. For example, one can merge networks belonging to different disease and compare how a subgraph differs from Alzheimer's to Parkinson's disease. We have also implemented an adapted version of the Network Pertubation Amplitude (NPA). This approachs allows users to directly see the effect of expression data on the networks.
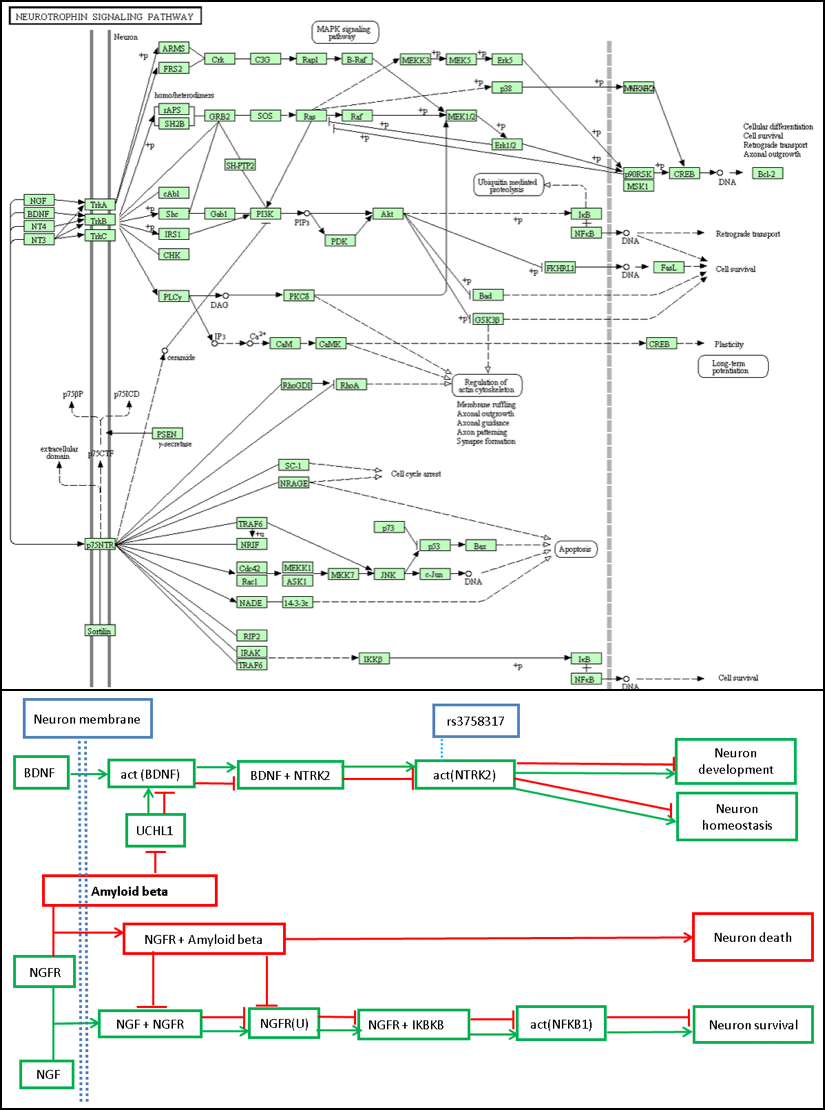
Figure 1. Comparison of the neutrophin signaling pathway between Alzheimer's disease BEL model and Canonical KEGG pathway. Red edges represent pathological state and green edge normal state. Amyloid beta associates with NGFR to inhibit neuron survival signals leading to neuron death in Alzheimer's (Kodamullil et al., 2015 & Kanehisa and Goto, 2000).
What is BEL?
A short introduction to BEL can be find here link. BEL is a language especially designed to represent scientific knowledge in a computable form by capturing causal and correlative relationships in context. In the neurodegenerative disease field, BEL is able to store additional information such as which of relationship exists between the biological entities acting, evidences supporting this relationship in the literature and many other specific annotations such as experiment conditions. Besides, BEL facilitates integration of multiple data types through its flexible and human readable syntax. Therefore, we found BEL ideal to build the models that made the core of NeuroMMSig.
Methodology
As a first step to group the BEL statements from the models by mechanistic/pathway information.Manual Annotation
The main aim was to identify mechanistic subnetworks from the models. The procedure was the following:- From SCAIView we have extracted all the disease specific related pathways using the query: [MeSH Disease:"Alzheimer Disease"] and show results in 'PTS' terminology.
- Manual curation of each of these 900 pathway terms and removed false positives or wrong entries (like Melanogenesis, Acetylation etc).
- Synonyms pathways were grouped (like amyloidogenesis and amyloid-beta peptide pathway) into one bin/pathway term (e.g., in this case Amylodogenic pathway).
SET Citation = {"PubMed", "J Mol Med", "12682725"}

                SET Evidence = "high-dose steroid treatment decreases vascular inflammation and ischemic
                tissue damage after myocardial infarction and stroke through direct vascular effects involving the
                nontranscriptional activation of eNOS"

                SET Species = "9606” #Taxonomy ID- Homo sapiens

                SET Tissue = "Vascular System”

                SET Disease = "Stroke“

                SET Subgraph = “Inflammatory response subgraph”

                a(CHEBI:corticosteroid) -| bp(MESHD:"Inflammation")
Enrichment ranking algorithm
After data submission, NeuroMMSig enrichment ranking algorithm calculates an enrichment score for the data-mapped subgraphs. The enrichment ranking algorithm returns a list of subgraphs with their correspondent scores and metadata information. Following, more details about the algorithm.
The enrichment algorithm evaluates a score given three different scores and their corresponding weights (equation 1). Weights are defined on a zero to one range and they can be set in the submission form of the NeuroMMSig server.
s=w1s1+w2s2+w3s3Proportional number of nodes mapped to the subgraph
In similar manner to pathway analysis methods — Over-representation analysis (ORA) in particular — measuring the percentage of mapped nodes is a common approach to calculate the enrichment of a network (Khatri et al., 2012). The higher the number of data that is mapped to nodes is, the greater the score. It is important to mention that not all nodes in the subgraphs can be mapped. For instance, entity types such as biological processes, chemicals or pathologies cannot be easily associated with mechanisms or pathways. Therefore, since they are not associated with subgraphs, only entities like gene sets and their corresponding associated imaging features and SNPs are taken into consideration when calculating the proportion of nodes that can be mapped.
s1=#Matches#PossibleMatchesScore 1 example: An user submits two genes as an input (DDR2,CRYAB) that map to this imaginary subgraph (graph below). In this case, the score 1 would be 1 since there are only two mappeable nodes (DDR2,CRYAB). The other two nodes (inflammatory response and innate immune response) are biological processes and cannot be mapped with data. If only one of the two genes is submitted, the score would be 0.5 (1/2).
s1=2(mapped)2(possiblemappings)=1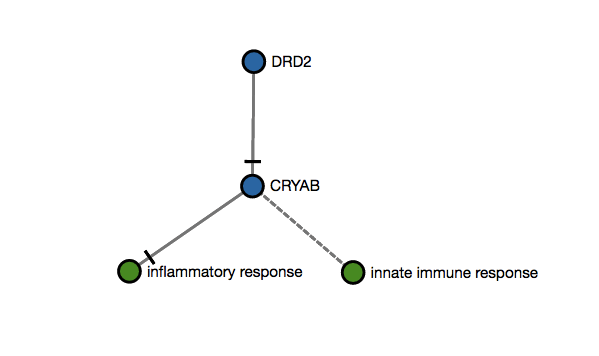
Analysis of graph topology: hubs
The second score aims to assign weights to nodes depending on their contribution to graph topology — following a similar strategy of PT-based methods. We compare different methods described in the literature and betweenness centrality was found a good indicator of node importance since it reflects the amount of control that this node exerts over the interactions of other nodes in the network. This approach of measuring node importance in biological networks coincided with other studies in the literature (Gu et al., 2012 and Joy et al., 2005).
NeuroMMSig considers then the top 5% of nodes in each subgraph with highest betweenness centrality as hubs. The calculations were performed removing all pathology nodes. Since pathology nodes are highly connected in the networks, their presence distorted shortest paths calculations which are the basic principle of betweenness centrality. When a network was smaller than 20 nodes, there is no ‘node-weighing’ based on hubs. As a conclusion, when data is mapped to any of these hub nodes, enrichment score for its correspoding subgraph is increased by the proportion of mapped hubs. As an example, if a network has two hubs and one of them is mapped, the value of the score accounting for hubs is 0.5.
Score 2 example
An user submits two genes as an input (DDR2,CRYAB) that map to this imaginary subgraph (graph below). Let's suppose that the betweenness centrality analysis in this subgraph ranks the CRYAB as the only hub. Then, score 2 would be 1 since there is only one hub and it has been mapped (1/n when is the total number of hubs in that subgraph). Please note that this is a simple illustration that would not apply since NeuroMMSig only calculates this score for graphs over 20 nodes (top 5% nodes are considered as hubs).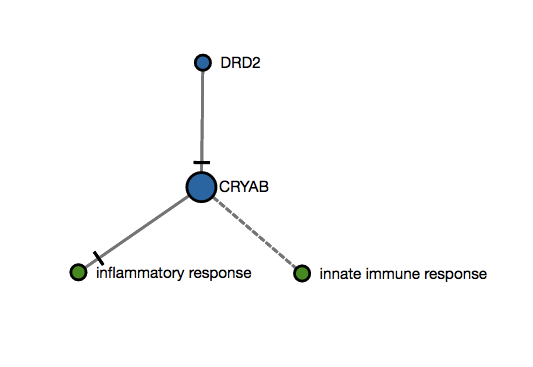
Analysis of graph topology: connectivity
The last score accounting for the final enrichment score is based on whether the nodes that have been mapped are close to each other and thus, their connectivity. Since mechanisms are chain of cause and effects (a collection of nodes and edges in subgraphs) one would expect a better enrichment score for a series of mapped nodes that are closely together than series where nodes are disperse between them. Therefore, this score assigns higher scores to neighbour nodes rather than spread ones. For that we used equation 2, where NG[i] is the number of mapped nodes that are also neighbours of node i and n is the total number of nodes mapped. Here, it is important to remark that because BEL implies directionality, networks are considered as directed graphs. As a consequence, when calculating this score from node 1 to node 2 (1->2), node 1 is a neighbour of 2 but not the other way around because one cannot traverse from node 2 to 1 in a direct graph. The denominator n(n-1) intends to normalize the score to 1 since n(n-1) are the total of possible connections in a directed graph.
It is important to mention that we do not consider BEL graphs multi-edge property. Thus, there would be no difference in the score if they are multiple edges going from node 1 to node 2, or only one edge. Summarizing, the score only considers the presence or not of an edge between nodes, not the type/number of them.
s3=∑niNG[i]n(n−1)Equation 2. Analysis of graph topology: connectivityScore 3 example
An user submits two genes as an input (DDR2,CRYAB) that map to this imaginary subgraph (graph below). In this subgraph, both genes are connected with one edge (DDR2 decreases CRYAB). In this case, the score 3 would be 0.5, since there is only one edge between the mapped nodes and the total of possible edges between them is 2 (n=2). s3=12(2−1)=0.5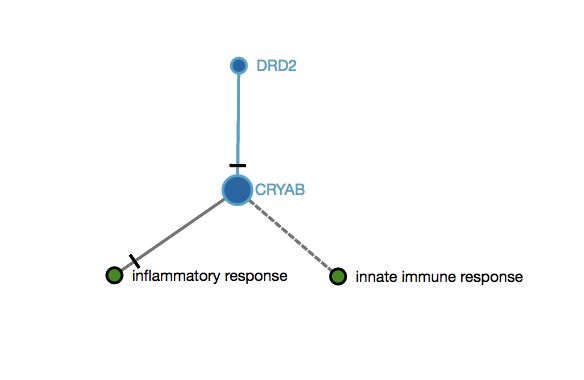 The final score when submitting these two genes (DDR2,CRYAB) taking into consideration the examples
above would be:
s=w11+w21+w30.5
The final score when submitting these two genes (DDR2,CRYAB) taking into consideration the examples
above would be:
s=w11+w21+w30.5
Mechanisms in subgraphs:
What do we call a mechanism?
“A chain of causes and effects forms a pathophysiological context, where minor dysregulation of molecular events may aggregate at a network level and lead to a pathological deviation from the normal state (Hofmann-Apitius et al., 2015)".
Once data is mapped to the subgraphs, we can identify the different ways the data-mapped nodes dysrupt a particular node of interest such a biological process. For more detail about how NeuroMMSig might identify possible dysregulated paths in the networks, please visit "How to use NeuroMMSig" section.
References:
Gu, Z. et al. (2012) Centrality-based pathway enrichment: a systematic approach for finding significant pathways dominated by key genes. BMC systems biology 6.1: 56.
Joy, M. P. et al. (2005) High-betweenness proteins in the yeast protein interaction network. BioMed Research International. 2: 96-103
Kanehisa, Minoru, and Susumu Goto. (2000) KEGG: kyoto encyclopedia of genes and genomes. Nucleic acids research 28.1 : 27-30.
Khatri, P. et al. (2012) Ten years of pathway analysis: current approaches and outstanding challenges. PLoS Comput Biol 8.2 e1002375
Kodamullil, A. et al. (2015) Computable cause-and-effect models of healthy and Alzheimer's disease states and their mechanistic differential analysis. Alzheimer's & Dementia 11.11 : 1329-1339.
Martin Hofmann-Apitius et al. (2015) Bioinformatics Mining and Modeling Methods for the Identification of Disease Mechanisms in Neurodegenerative Disorders. eng. In: Int J Mol Sci 16.12, pp. 29179–29206. doi: 10.3390/ijms161226148. url: http://dx.doi.org/10.3390/ijms161226148